


MaxDecisions: FICO 9 vs. Vantage 4 – The final verdict
Credit Score
Research Overview
There’s been a 17 year debate between the predictive power of FICO score versus Vantage score since Vantage launched in 2006.
There’s been many articles and research paper from various leading credit risk experts about the benefits of each score, we are here to provide an unbiased, statistical driven comparison between the latest versions of these two competing scores.
Primer
Scores, in the context of credit risk management are used to assess an applicant or a small businesses’s credit worthiness. That is to say, that when a bank or lender offers an individual or a small business lines of credit, it often uses this score to measure the likelihood of delinquency or repayment.
In popular culture, FICO score is often used in our vernacular to judge some one’s financial standing, their financial responsibility and sometimes erroneously attributes to someone’s societal social standing. FICO stands for Fair Isaac and Company established in 1956 (67 years ago) by Bill Fair and Earl Isaac is the leading credit score, certainly the most well known credit score in the United States and abroad.
Vantage, as we eluded to earlier is a relatively new kid on the block. Legend has it that the three main credit bureaus came together a number of years ago and combined efforts to stand up an alternative credit score to rival Fair Issac. Similar to the consortium behind Zelle, the major credit bureaus put their collective data together, presumably with a bigger sample set to build a competing score, and the result of that effort is the Vantage Score.
The latest version of the FICO score is FICO 9 or FICO version 9. FICO 9 was first published in 2014, taking post 2008 economic downturn data into consideration and corrected the recessionary “bias” from their scores.
Vantage 4.0, the latest version of Vantage Score was released in 2017. One of the biggest differences in terms of model construction is that FICO score was created based on individual credit bureau’s data where as Vantage standardized credit attributes across all three bureaus and was built on so called “tri-bureau” dataset.
In essence, each credit bureau’s FICO algorithm is slightly different where as Vantage uses the same algorithm across all bureaus. There are pros and cons of each approach. One of the major reasons for bureaus specific score is that each bureau consists of data from their own membership or financial institutions. Plus, each bureau has their unique way of deriving attributes, such as how they are accounting for inquiries. Therefore, building a specific score for each of these bureaus might be advantages than building these models on a more normalized approach across all three credit bureaus.
Comparison
We sampled 20+ million US consumers from an early 2021 vintage. This particular set of data is a representation of what we believe to be “Middle America” and of course each individual credit report has both Vantage 4.0 and FICO 9.0 appended to the data set for a one for one direct comparison.
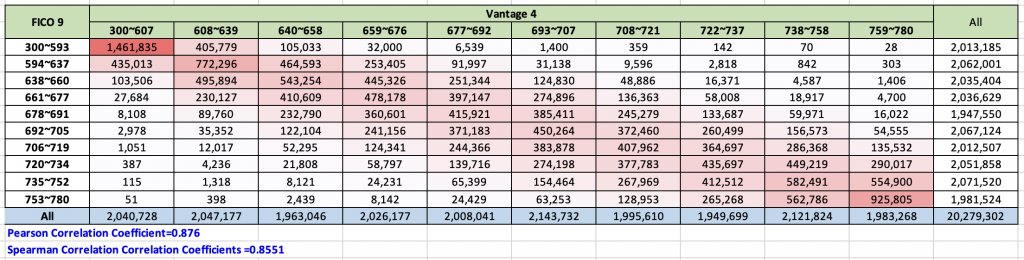
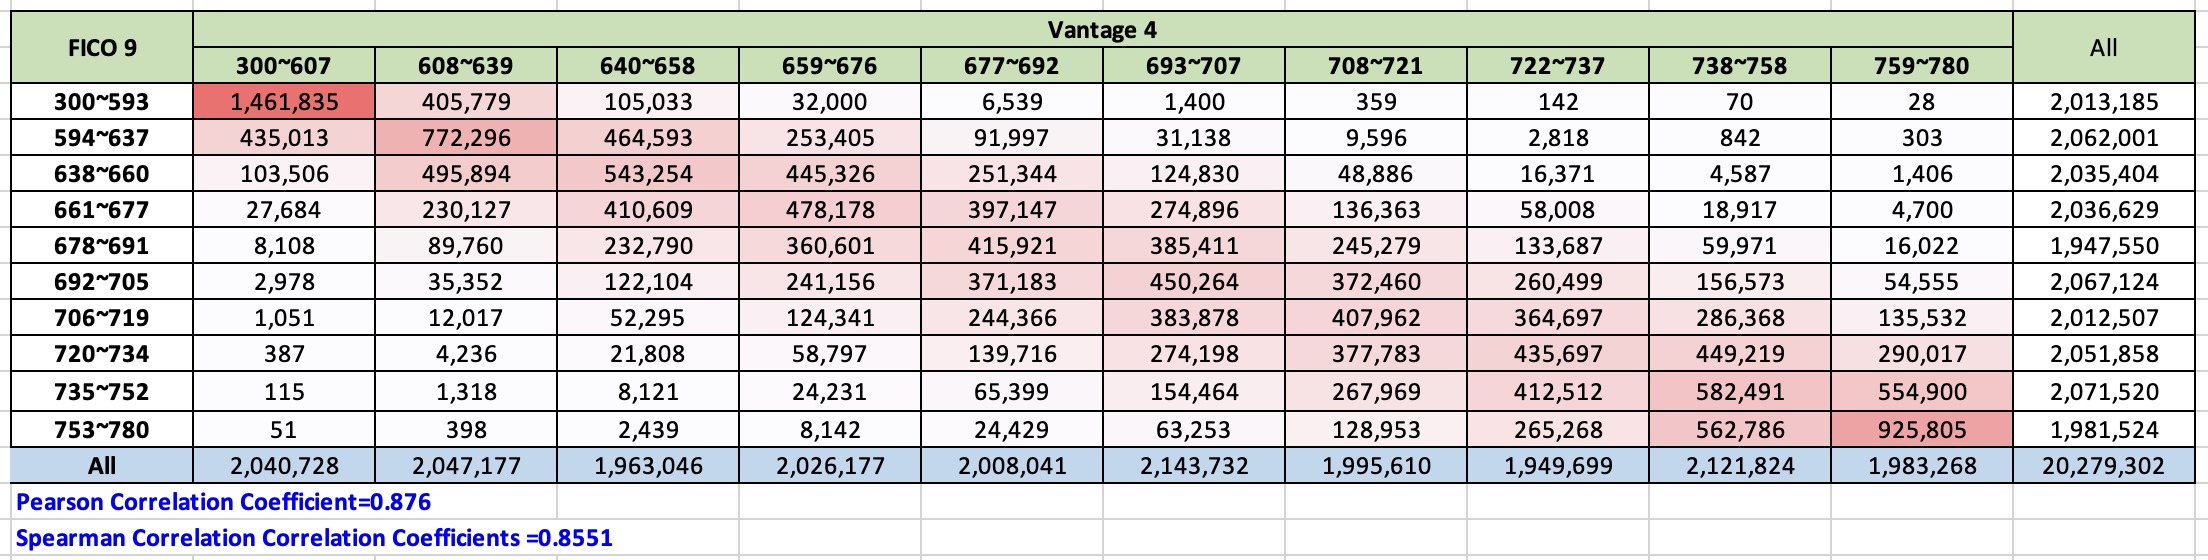
Let’s interpret the chart above. First we spliced the entire 20+ million population in to decile (10%) bins. Each bin for instance contains approximate 10% of the population. These bins are defined by FICO score ranges (e.g. 300-593) and Vantage score ranges (300-607).
We can observe that roughly the entire population falls on the diagonal line, also represented with a variation shades of a pinkish red color. In other words, FICO and Vantage score are closely correlated, that is to say, when FICO says someone is of high quality, Vantage score roughly will say the same.
Conversely, if Vantage scores someone in the subprime space, FICO agrees most of the time.
But there are differences, if we look at the upper right hand corner and lower left hand corner of the graph, thats where FICO and Vantage disagrees.
As an extremely example, there are 28 people in the FICO score 759 to 780 bin that Vantage deem to be deep subprime between 300-593. On the opposite side, there are 51 people which Vantage deemed to be extremely high quality but FICO says they are in the 300-607 range. These anomalies are hard to explain and we believe it’s likely due to lack of information and each scoring algorithm has a difference in their missing value replacement sub-routine that could cause this disagreement in their assessment.
Nevertheless, these two scores are fairly aligned and let’s take a look at some statistical treatment below.
Statistical Tests:
Pearson correlation coefficient is is a measure of linear correlation between two sets of data. It is the ratio between the covariance of two variables and the product of their standard deviations; thus, it is essentially a normalized measurement of the covariance, such that the result always has a value between −1 and 1. – https://en.wikipedia.org/wiki/Pearson_correlation_coefficient.
In other words, Pearsons Correlation Coefficient describes the relationship between these two variables (FICO and Vantage) and that if one variables changes (going up and down on the FICO scale), the other variable changes in the same direction.
If the correlations coefficient is 0, there is no relationship. If the Pearson correlation coefficient is between 0 to 1, then it has a positive correlation which in our case is 0.876. By definition if the correlation coefficient is great than positive 0.5, it means these two variables are strongly correlated. That is to say, as one score goes higher, the other score closely follows in the same direction. A Pearson correlation coefficient of 0.876 indicates a very strong relationship between FICO and Vantage score.
We took another statistical measure to these two scores to estimate the relationship between FICO and Vantage. This time we used Spearman correlation coefficient.
Spearman correlation coefficient is a nonparametric measure of rank correlation (statistical dependence between the rankings of two variables). It assesses how well the relationship between two variables can be described using a monotonic function. https://en.wikipedia.org/wiki/Spearman%27s_rank_correlation_coefficient
Where Spearman correlation coefficient shines is that even if the underlying datasets aren’t non-linear, this method can still find the correlation between two datasets. When we use this method to calculate the correlation between FICO 9 and Vantage 4, we have a value of 0.8551. We will translate this value the same way we do with Pearsons Correlation Coefficient, in essence, these two datasets are highly correlated positively in a monotonic fashion.
Regression Methods:
We also used each of the scores to to regress against each other. Essentially use each score to model or estimate the other score using various regression methods
We use the ever popular linear regression method using each score to estimate their counterpart. We also used Quadratic and Cubic regression in case there are special curvatures in these scores that needs to be considered.
We then use the R-squared value to determine the variation of these two scores from each other. In statistics, the coefficient of determination, denoted R2 or r2 and pronounced “R squared”, is the proportion of the variation in the dependent variable that is predictable from the independent variable(s). https://en.wikipedia.org/wiki/Coefficient_of_determination
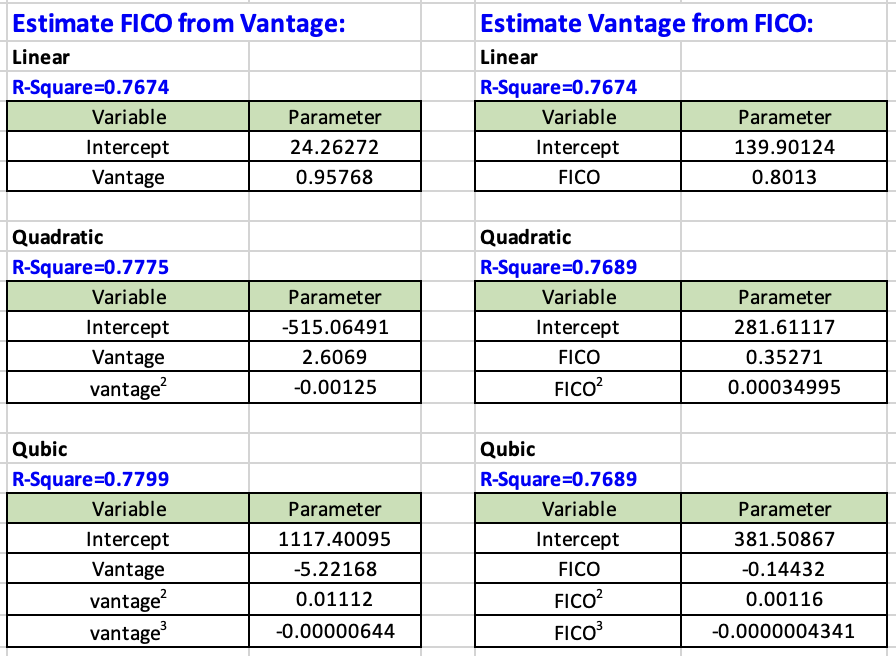
When we look at various R-Square values from each of these regression methods, we have a range of 0.7674 to 0.7775.
R2 is a measure of the goodness of fit of a model. In regression, the R2 coefficient of determination is a statistical measure of how well the regression predictions approximate the real data points. An R2 of 1 indicates that the regression predictions perfectly fit the data. https://en.wikipedia.org/wiki/Coefficient_of_determination
Since our R-squared value is about 0.77, these two scores, FICO 9 and Vantage 4 could do a decent job predicting each other. Keep in mind that we only use the score itself to predict the other score, no other additive variables were used in the construct of these regression models.
What did we prove? The only thing we can say about these two scores is that they are first, highly correlated by the correlation coefficient tests and one score can be used to predict or estimate the other score.
Bin vs. Bin | Avg vs. Avg:
The devil is in the details. However, before we get to our conclusion, we stratified our 20 million dataset into 2% population bins. Meaning that we spliced these 20 million plus consumers into 2% (approximately 400,000 consumers in each population bin).
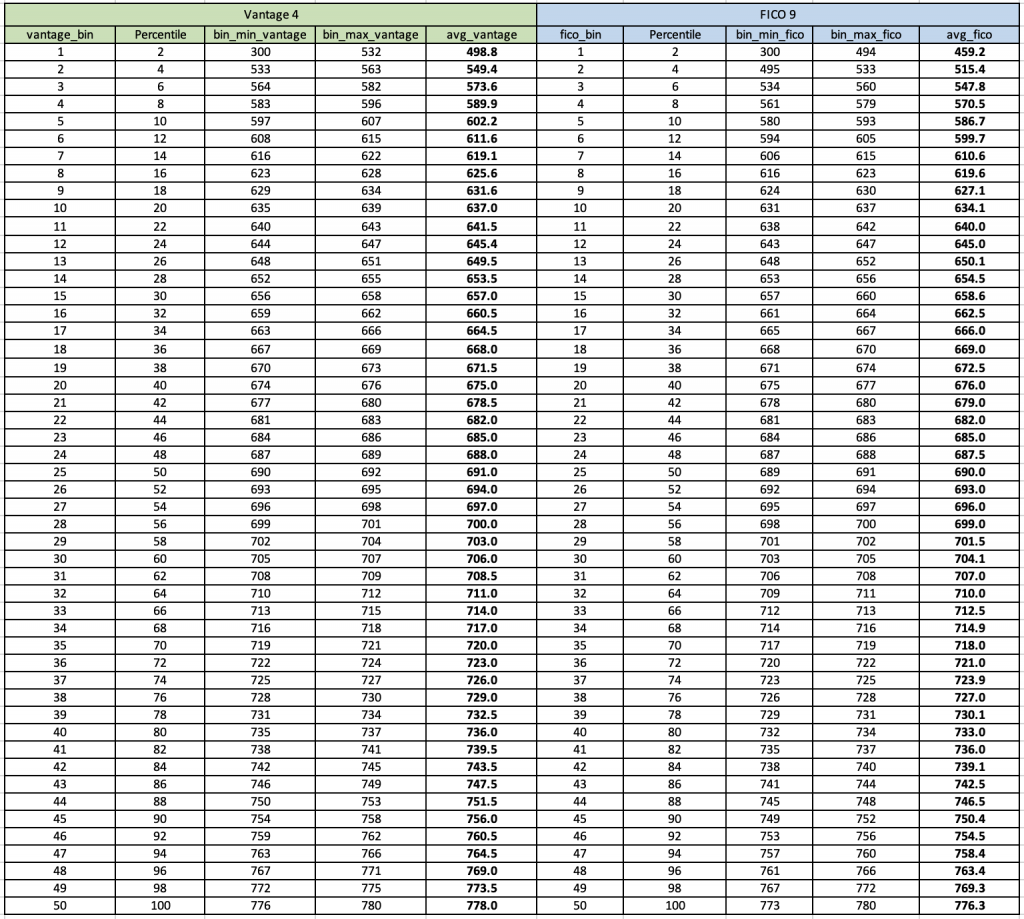
We binned this dataset by their perspective credit score ranges. For example, the top bin of our Vantage 4 score which contains 2% of the population has a score range of 300 to 532 with an average Vantage 4 score of 498.8. The same top bin from FICO 9’s top 2% population bin has a range or 300 to 494 with an average of 459.2. Three is almost a 40 point difference.
However, when we move to the middle of the population, say bin number 25, Vantage 4’s score range for that 2% silver ranges from 690 to 692 with an average score of 691. If we look at the equivalent bin on the Vantage side, it has a range of 689 to 691 with an average score of 690. 1 point difference than Vantage.
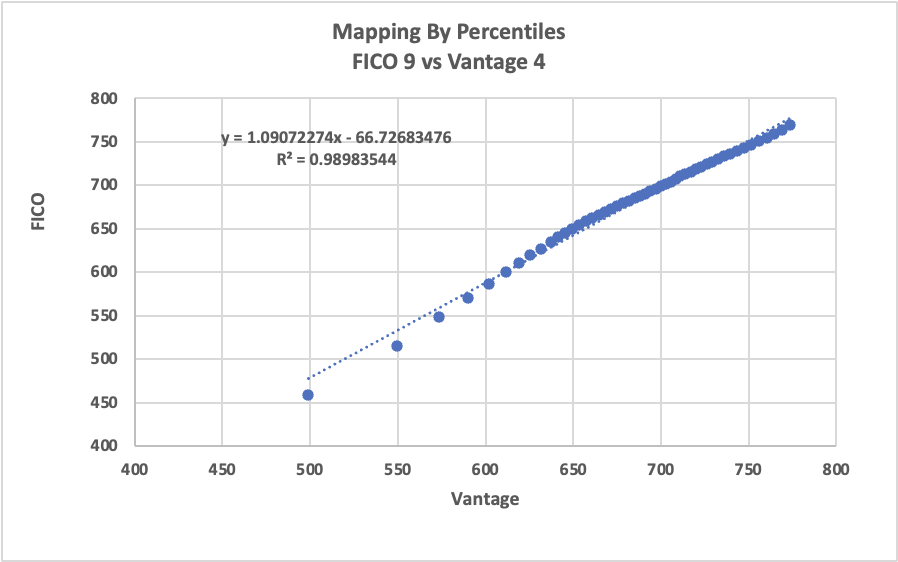
We when plot the average values from FICO 9 vs. Vantage 4, we see that they are very close to each other with a Linear Regression R-squared value of 0.98983544 (virtually identical to each other).
However, where these two scores start to differ is below 650 score range and below (from both sides of the score aisle). The delta in pure point differences starts around 3 to 8 points, to 11 to 20 points and to at the tail end of the population, the score can differ by 25 to 40 points (especially below 550 score range or below).
Vantage score consistently scores higher than FICO score below 600 score range. Once again, we are not making a statement about the effectiveness of these scores but simply identifying the trend and differences between these two scores.
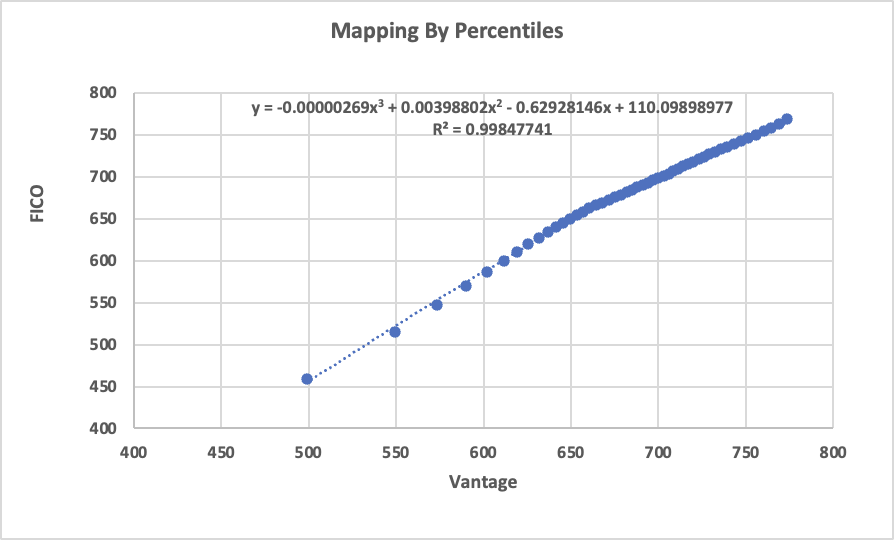
Additionally, when we use a quadric equation to estimate the difference these two scores, we get a R-squared value of 0.99847741, an even closer estimation between these two scores, they are virtually identical.
Insights:
1. These two scores are essentially identical to each other if you are in the near prime, prime and super prime space. Again, we are not commenting on the effectiveness of these scores in terms of credit loss detection. It’s jus that they are very similar.
2. If you are in the subprime or deep subprime space, use these two scores with caution. If you are using FICO, you could be penalizing unnecessarily of subprime clients. Again, if you believe that FICO does not predict charge offs or bad as well as it should, relative to Vantage. But you could also make a mistake using Vantage 4 to score this subprime or deep subprime population, and that Vantage score might think this particular population is better than they are. Again we see Vantage score consistently scores the subprime population higher, sometimes as high as 10, 20, 30 or 40 points.
Actions:
If you like where your default rate lies, and you are thinking about testing the alternate score, be it FICO or Vantage, we advise you to run the the alternate score in parallel for a few vintages. Just because the scores are virtually the same, they may have different predictive power.
That is to say, if your score cut off on Vantage 4 is 650, simply switching to FICO 9 and use the same cut off at 650 might be hurting your business. One one hand your decline rate might be same, but your default rate could vary.
If you are in the subprime or deep-subprime space. You need to pay even more attention if you are thinking about testing an alternate score. Let’s say that you have being using FICO 9 and your score cut off is 550. Switching to Vantage and setting your score cut off at 570 will maintain the same decline rate, but it could have a dramatic effect on your default rate.
You either need to run these scores in parallel for a time period or be a little more conservative when switching to an alternate score. With the example above, we would recommend that you set your Vantage score at 580 or 590, even though you maybe decline 4 more percentage of the incoming population, at least you are somewhat protected from an onslaught of default shock. You can always adjust the score cut off on your alternate score after a few payment cycles of these new vintages.
As always, we appreciate everyone reading our thoughts and write to us at info@maxdecision.com
Thank you!
MaxDecisions Research Team