


How we approximated industry leading credit Score in 30 Minutes
Credit Score
Credit score is probably the widely know credit risk score that everyone in the industry uses. Whether it is used to grant credit, approval for a rental agreement, there is no avoiding the infamous credit score.
Sure, there has been challengers to one of the leading credit scores throughout the years. Even the credit bureaus have banded together to unseat the champ. But one of the leading credit scores remains the undisputed champion of banking and lending industry.
In other countries such as China, credit scoring and national credit bureaus aren’t widely available. Folks at Tencent, for example, got very creative and started using activities in WeChat (a population Chinese chat program) to assess employability of a potential borrower. If suddenly the borrower got disinvited from a work chatting group, that could be a sign of pending unemployment.
Recently, our team ran an experiment to see if we can figure out the guts of one of the leading credit scores score. Like Coca Cola, the secret recipe is probably guarded with utmost security. Even if you somehow managed to get the actual formula of one of the leading credit scores score, it will be difficult for someone to replicate it due to lack of data.
We all know that this leading credit scores is made up of these categories of behavior:
- Delinquencies
- Debt Ratio
- Average Age of Credit Life
- Mixture of Credit Tradelines
- Number of inquiries
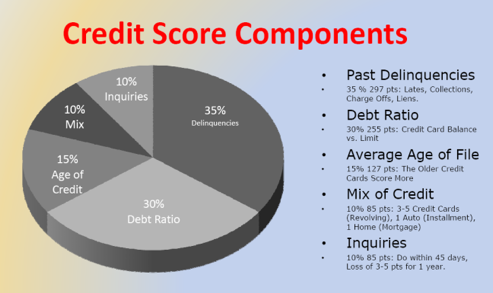
But is the actual makeup of the industry leading credit score really as simple as what the above pie charts says. E.g. Delinquencies accounts for exactly 35% of the industry leading credit score? Let’s find out.
Our team trained this industry leading score score as a dependent variable (call me for a crash course on statistics, no time to explain, we have 30 minutes) and fixed over 500 credit attributes as independent variables. After a few tries of stepwise regression analysis. We actually came pretty darn close.
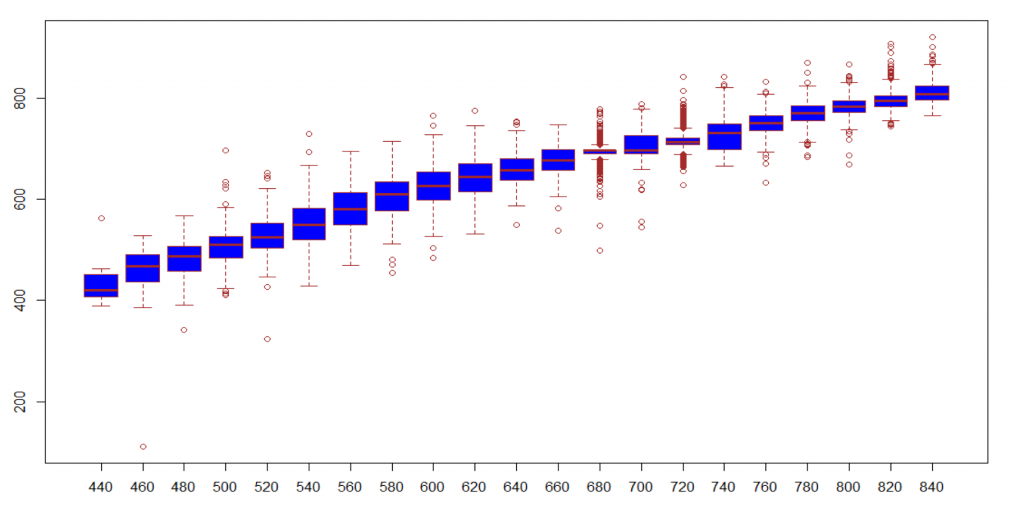
The Y-axis is our “Predicted Credit Score” and X-axis is the actual credit score. Grade school math tells us that if the value of the x-coordinates is exactly the same as the value of the y-coordinates, then X (actual Credit Score) and Y (predicted Credit Score) is exactly the same.
Well, we aren’t that lucky. However we did get a R-Square of 0.8703 (R-Squared is a goodness of fit test and a value of 1 means a perfect correlation between two distributions.
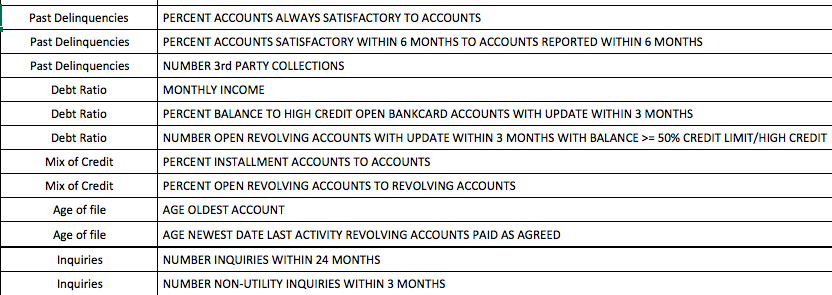
Head hurting yet? No problem… here are the selected sample of possible Credit Score ingredients. Use it at your discretion.